
1. Utility cannot be measured
2. When the consumer is given more of a commodity, he will always prefer to have more to less of that commodity.
3. It is based on the Principle of Transitivity. If there are many combinations of two commodities, and if the consumer is indifferent between the combinations of A and B, and also indifferent between B and C, so he will be indifferent between the combinations of A and C.
4. The Indifference Curve Analysis is based on the Law of Diminishing Marginal Rate of Substitution.

Properties of Indifference Curve
There are definite properties of the Indifference Curve(IC). On these properties is built the shape of the IC.
1. An IC slopes downwards from left to right, because as the consumer increases the consumption of one commodity, he has to decrease the consumption of another commodity in order to remain at the same satisfaction level.
2. The IC cannot touch either the X-axis or the Y-axis, because if the IC touches either of the axes, then the consumer will purchase only one commodity. But this is against the concept of the IC. IC is the representation of the same satisfaction obtained from different combinations of two commodities.

3. The higher IC gives more satisfaction than the lower IC, because in the higher indifference curve the consumer will have more of the commodities. Also, the consumer will always prefer to have more to less of that commodity. In the diagram IC4(highest) gives the maximum satisfaction to the consumer because on this curve the consumer will have more of the commodities.
4. The different indifference curves cannot cut each other at any point. If two ICs cut each other at a point, satisfaction obtained from both the curves will be the same. This is against the property of IC. All the points on a higher indifference curve give more satisfaction than all the points on a lower indifference curve.
5. An indifference curve is convex to the origin because it is based on the law of Diminishing Marginal Rate of Substitution.
Diminishing Marginal Rate of Substitution
Statement of the Law: If there are two commodities, the consumer will substitute one commodity for the other commodity in order to get the same satisfaction, but the marginal rate of substitution will be diminishing.
This can be explained with the following example. Figures are units consumed of commodities X and Y.
Combination A (X=1, Y=15, Substitution=0),
Combination B (X=2, Y=11, Substitution X = 2-1= 1, substitution Y = 15-11 = 4 )
Combination C (X=3, Y= 8, Substitution X = 3-2= 1, substitution Y = 11-8 = 3)
Combination D (X=4, Y= 6, Substitution X = 4-3= 1, substitution Y = 8-6 = 2 )
Combination E (X=5, Y= 5, Substitution X = 5-4= 1, substitution Y = 6-5 = 1 )
Substitution of commodity Y gradually diminishes from 5 to 4 to 3 to 2 to 1.
Diagram of Marginal Rate of Substitution
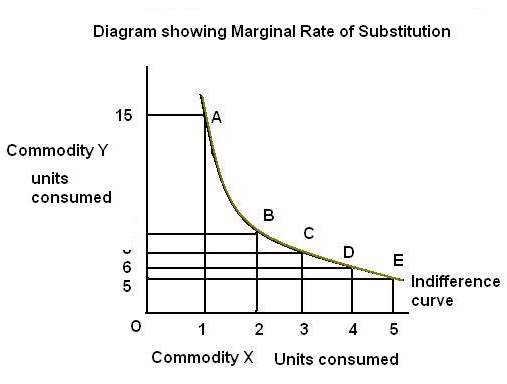
When the Indifference curve is convex to the origin, the Law of Diminishing Marginal Rate of Substitution will be applicable.
The Indifference curve can never be a straight line or concave to the origin.

Consumer's Equilibrium
Meaning: the consumer will be at an equilibrium position when he gets the maximum satisfaction out of his consumption. At this position he is not willing to make any alterations in his pattern of consumption.
Assumptions: In order to find out the consumer's equilibrium position with the help of IC Analysis, we make the following assumptions.
1. The consumer has an indifference map.
2. The consumer has a fixed amount of income, and he will spend the whole of the income on the goods or commodities, which are available in the market.
3. There are only two commodities available in the market. This is done to keep the discussion simple and easy to comprehend.
4. The prices of these two commodities are fixed.
5. These two commodities are finely divisible.
6. The consumer acts rationally.
Now if we combine the indifference map and the price line, we can find out the consumer's equilibrium position, because the indifference map shows the scale of preferences of the consumer and the price line shows the purchasing power of the consumer.
In the diagram below we combine the indifference map and the price line.

Conclusion: thus according to the Indifference Curve analysis the consumer will be at equilibrium when the price line is tangent to the highest Indifference curve.
New equilibrium position under Indifference curve analysis
The equilibrium position of the consumer will be found out on the assumption that income of the consumer will remain constant. Now if there is any change either in the income of the consumer or prices of commodities, there will be a change in the equilibrium position.
No comments:
Post a Comment
Want to say something? Say it!